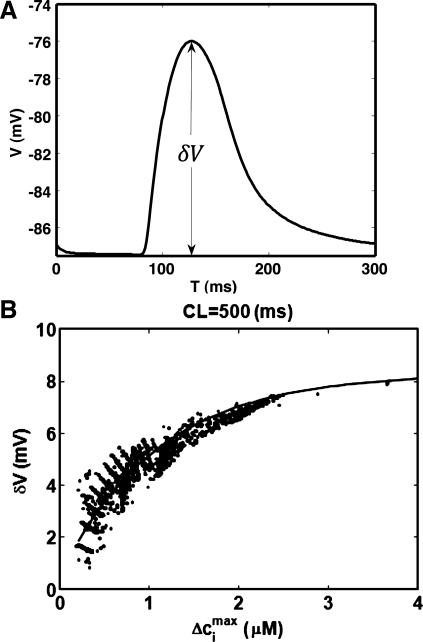
Fig. 8.
Simulation of SCR-induced delayed after-depolarizations (DADs). A: plot of a typical voltage deflection attributable to SCR. The change of voltage attributable to SCR is denoted as δV. B: plot δV vs. Δcimax computed for the first episode of SCR. Each point represents an independent simulation run.

