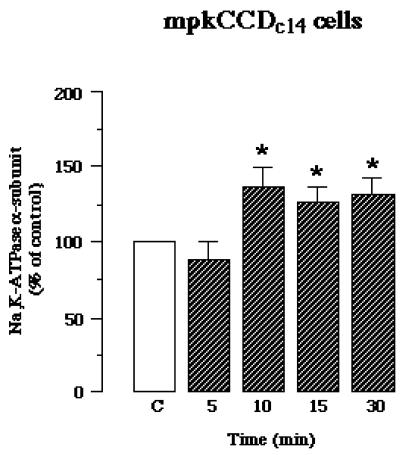
Figure 4.
Time course of the effect of db-cAMP on cell surface Na,K-ATPase in mpkCCDc14 cells. Cells were incubated in the absence (C) or presence of 10−3 M db-cAMP for 5, 10, 15, or 30 min at 37°C. After biotinylation, cells were lysed and labeled proteins were precipitated by streptavidin-agarose beads. The Na,K-ATPase α-subunit was detected by Western blotting as described in Figure 3. Bars represent the densitometric quantification (means ± SE) from six independent experiments. Results are expressed as percentage of the optical density values from untreated samples (C); ∗, p < 0.05 versus control values.

