Figure 5.
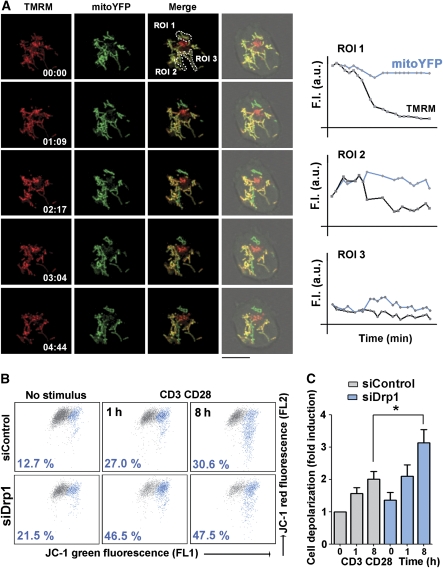
Mitochondria depolarize at sites of TCR activation. (A) Confocal video-microscopy of mitoYFP-transfected J77 T cells loaded with the mitochondrial membrane potential dye TMRM and plated on coverslips coated with CD3 plus CD28 Abs. Images record the movement of individual mitochondria in a confocal plane at the activating surface. Profile plots show time courses of mitoYFP and TMRM fluorescence intensity in the indicated mitochondria (regions of interest, ROI), showing variations in Δψm (see Materials and methods section). (B, C) Flow cytometry analysis of mitochondrial membrane potential (Δψm FL2 versus FL1 JC-1 fluorescence) in control and Drp1-silenced human T lymphoblasts activated with anti-CD3 (10 μg/ml) plus anti-CD28 (5 μg/ml) and loaded with the mitochondrial potentiometric tracker JC-1. (B) The dot plots show a representative experiment of four. The percentage cell population with depolarized mitochondria (blue) is indicated. (C) Quantification of cells exhibiting mitochondrial depolarization in control and siDrp1-expressing human T lymphoblasts activated with CD3 plus CD28 Abs. Data are means±s.d. from four donors (*P<0.05).

