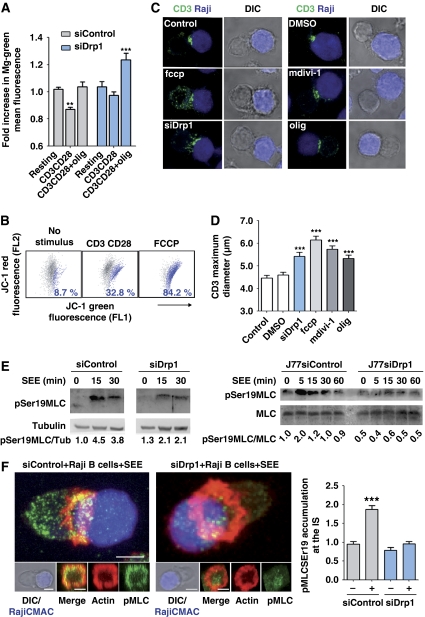
Figure 6.
Drp1 regulates T-cell activation-induced mitochondrial depolarization and myosin fuelling at the IS. (A) Relative ATP content was measured with the magnesium green probe (Mg-Gr), whose fluorescence intensity inversely correlates with intracellular ATP. Control and Drp1-silenced J77 T cells were stimulated with CD3 plus CD28 Abs and treated with vehicle or oligomycin. Data are means±s.d. from three independent experiments performed in triplicate (**P<0.01, ***P<0.001). (B) Dot plots of FL1 and FL2 JC-1 fluorescence in human T lymphoblasts activated with CD3 plus CD28 Abs and loaded with JC-1 as in Figure 5B. FCCP (250 nM) was used for maximal Δψm depolarization. A representative experiment is shown with primary T lymphoblasts from one of the three donors. (C) Confocal analysis of CD3 organization (green) in SEE-dependent conjugates formed by control J77 T cells, Drp1-silenced J77 T cells or J77 cells treated with mdivi-1, FCCP, oligomycin or vehicle. SEE-pulsed Raji B cells were CMAC loaded (blue). Scale bar, 10 μm. (D) CD3 maximum diameter in J77 T cells conjugated as in (C). The numbers of conjugates analysed for each condition were 409 (control), 136 (siDrp1), 313 (midiv-1), 339 (FCCP) and 230 (oligomycin). Data are means±s.d. from three independent experiments (***P<0.001). (E) Time course of the phosphorylation of myosin regulatory light chain at Ser19 in conjugates formed between control and Drp1-silenced human primary T lymphoblasts or J77 T cells and SEE-pulsed Raji B cells. Total expression of MLC and tubulin are shown as loading controls. Representative blots of three experiments are shown. Numbers beneath the blots denote pMLC/Tub and pMLC/MLC ratios. (F) Confocal analysis of pMLCSer19 (green), actin (red) in control and siDrp1 J77 T cells conjugated with SEE-pulsed Raji B cells (CMAC, blue). 3D stack reconstructions show pMLCSer19 and the actin ring at the contact site between control and siRNA Drp1-silenced J77 T cells and the APC. The chart shows quantification of pMLCSer19 accumulation at the IS in control and siDrp1-silenced cells in SEE-specific conjugates. Data are means±s.d. from two independent experiments (***P<0.001).

