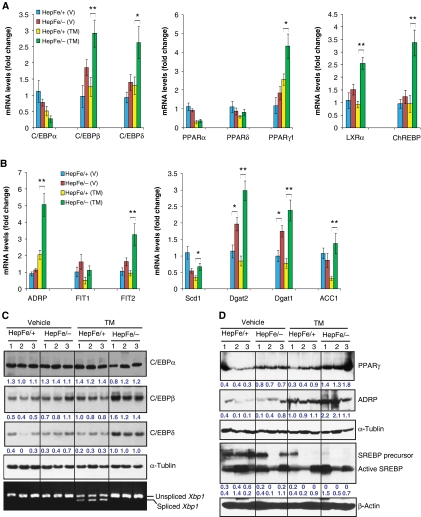
Figure 5.
IRE1α represses expression of key lipogenic regulators in the liver in response to ER stress. (A, B) Quantitative real-time RT–PCR analysis of liver mRNA in Ire1αHepfe/− and Ire1αHepfe/+ mice. Total RNAs from the livers of Ire1αHepfe/− and Ire1αHepfe/+ mice at 3 months of age at 8 h after injection with TM (2 μg/g body weight) or vehicle (V) were subjected to quantitative real-time RT–PCR analysis. Expression values were normalized to β-actin mRNA. Fold changes are shown relative to mRNA expression in one of the control (Ire1αHepfe/+) untreated mouse livers. Each bar denotes the mean±s.e.m. (n=6 mice per group); *P<0.05; **P<0.01. P-values are shown for statistically significant differences. (C, D) Western blot analysis of liver tissue from Ire1αHepfe/− and Ire1αHepfe/+ mice at 8 h after injection with TM (2 μg/g body weight) or vehicle. Semiquantitative RT–PCR analysis was performed to measure the levels of spliced and unspliced Xbp1 mRNAs as an indicator of IRE1α activity in the livers (C, bottom panel). In western blot analysis of C/EBPβ, we detected the C/EBPβ LAP (liver-enriched transcriptional activator protein) isoform of about 35 kDa in the mouse liver tissue samples (Calkhoven et al, 2000). Because PPARγ2 was not detected at the mRNA level in the liver tissue in the absence or presence of TM challenge (A, B), the PPARγ signals from the western blot analysis likely reflected PPARγ1. The experiments were repeated at least three times with consistent results, and representative data are shown. The values below the gels represent protein signal intensities after normalization to that of α-tubulin.

