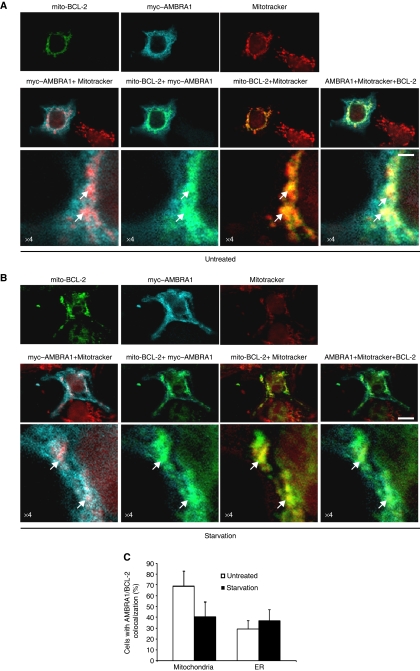
Figure 4.
AMBRA1 dynamic colocalization with mito-BCL-2 and the mitochondrial network. (A, B) HEK293 cells co-transfected with vectors encoding mito-BCL-2 and myc-AMBRA1, grown either in normal media (A) or in EBSS (B) for 4 h and stained with an anti-BCL-2 antibody (green), an anti-myc–AMBRA1 antibody (blu) and Mitotracker (red). The merge of the two or three fluorescence signals are shown in the bottom panels, as indicated. Scale bar, 6 μm. White arrows point to strong triple colocalization areas. (C) AMBRA1–mito-BCL-2 colocalization decreases after autophagy induction. Quantification of cells showing colocalization between AMBRA1 and ER- or mito-BCL-2 in normal conditions and after autophagy induction is shown. Results are expressed as percentage of cells (±s.d.) showing colocalization between AMBRA1 and ER- or mito-BCL-2. Each point value represents the mean±s.d. of triplicate wells from three independent experiments. Statistical analysis was performed by analysis of variance (one-way ANOVA). *P<0.05 versus mito-BCL-2 in normal conditions.

