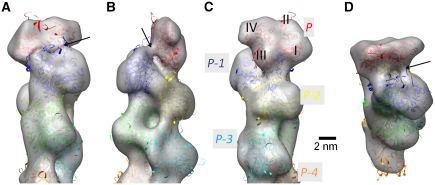
Figure 1.
The three-dimensional electron density map of the actin filament pointed end was obtained by cryo-electron microscopy at a contour level that envelops 100% of the calculated volume. (A−C) The viewing angle around the filament axis is 0, 90 or 180°, respectively. (D) As in (A), with the filament axis tilted by 60° towards the viewer. In (C), each actin subunit is labeled as P, P-1, P-2… starting from the subunit at the pointed end. Also labeled are individual subdomains (I−IV), which are clearly distinguished in each subunit up to the pointed end. The ribbon-represented atomic models, coloured separately for each subunit, superposed on the EM map in (A−D) are the final model after the molecular dynamics simulation. Black arrows in (A, B and D) indicate the bridge-like density connecting the subdomain II of P-1 with the subunit P.

