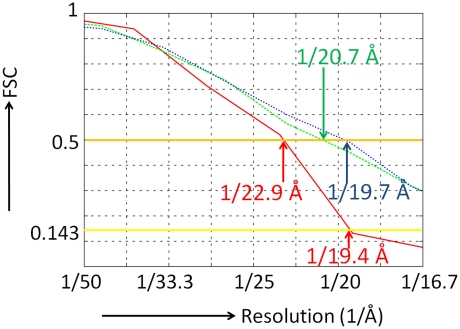
Figure 2.
The resolution of the EM map and the consistency between the EM map and the atomic models were evaluated by Fourier Shell Correlation (FSC) (van Heel, 1987). The thick orange line indicates FSC=0.5, which is a standard value used for the threshold, whereas the thick yellow line is FSC=0.143, and represents a second threshold (Rosenthal and Henderson, 2003). The resolution of the map was evaluated by FSC as the consistency between the two maps, each of which was reconstructed from each half of all the EM images. The resultant FSC is presented in red, indicating a resolution of the EM map as 22.9 or 19.4 Å with thresholds of 0.5 and 0.143, respectively. The FSC between the EM map and the atomic model of the fitted subunits as rigid bodies to the EM map (Figure 4A) is presented in green, indicating the model is consistent with the map up to 20.7 Å with a threshold of 0.5. The FSC between the EM map and the final model with the two loops modified by the MD is presented in blue. The consistency was improved up to 19.7 Å.

