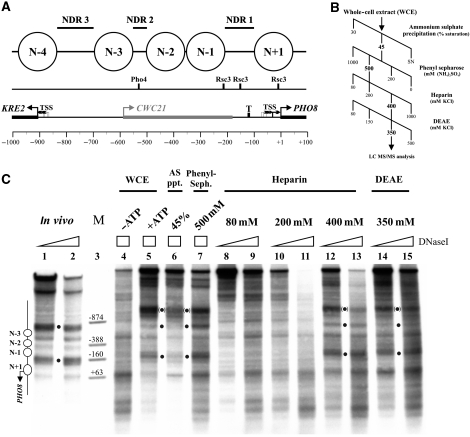
Figure 1.
The nucleosome positioning activity for the PHO8 promoter could be enriched from a yeast whole-cell extract (WCE) over four sequential fractionation steps. (A) Top panel: schematics of nucleosome positions at the KRE2-CWC21-PHO8 locus, according to Barbaric et al (1992) and Jiang and Pugh (2009). Nucleosomes are numbered relative to NDR1. Middle panel: mapped Pho4 (Barbaric et al, 1992) or predicted Rsc3 (Badis et al, 2008) binding sites (Supplementary Figure S8A). Lower panel: KRE2, CWC21 and PHO8 open reading frames (rectangular bars with large broken arrows), TATA box (T; Basehoar et al, 2004) and transcriptional start sites (TSS, small broken arrows; Miura et al, 2006). Scale bar: distance in base pairs from PHO8 ORF start. All panels drawn to scale. (B) Extract fractionation scheme. Fractions positive for the PHO8 promoter nucleosome positioning activity are labelled in bold. SN, supernatant. (C) DNaseI indirect end labelling analysis of the PHO8 promoter region in vivo or in vitro after salt gradient dialysis assembly and incubation with either WCE in the presence or absence of ATP, or with one of the indicated fractions (see B) in the presence of ATP. Black dots: diagnostic bands, which are characteristic for the in vivo pattern and seen in vitro only in the presence of ATP and the nucleosome positioning activity. Black dots in parentheses: hypersensitive site within the lacZ ORF of the pUC19 backbone specific for the in vitro pattern that always co-occurred with the in vivo-like PHO8 promoter pattern. The yeast sequence terminates close to the top marker band. Schematics on the left analogous to (A). Position of marker bands is labelled relative to the PHO8 ORF start. Ramps and boxes: relative DNaseI concentrations. All samples were electrophoresed alongside in the same gel, but the in vivo samples migrated slightly faster, probably because of different total DNA concentration.

