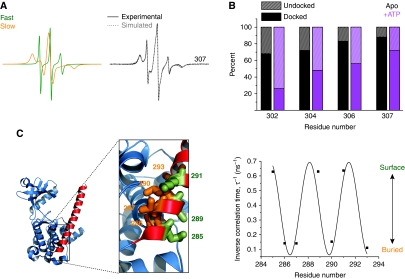
Figure 2.
(A) Analysis of spin label dynamics at site 307. The experimental EPR spectrum was fit by two components using the MOMD analysis as described in the Materials and methods section. The fast component (green spectrum) arises from an unstructured, undocked conformation of the R3 segment while the slow (orange spectrum) component arises from a docked conformation. (B) Percentages of the fast and the slow components for representative residues in the R3 segment in the apo CaMKII state (black bars) and the ATP-bound state (purple bars). (C) Inverse correlation times (τ−1) for sites in the R1 region plotted versus residue number. The correlation time was determined from non-linear least-squares analysis of the EPR spectra (see Materials and methods). The superimposed sinusoid fit to the data has a 3.7 period. The local environment of these residues in the crystal structure (PDB 2BDW) is shown to highlight the agreement with the EPR data (image created with PyMOL, DeLano Scientific (DeLano, 2002)). Thus, residues on the surface (green) (e.g. 289) have a large τ−1 while those at the interface with the catalytic domain (orange) have small τ−1.

