Figure 3.
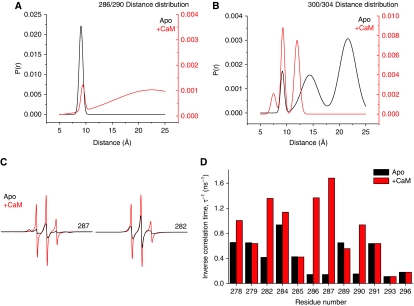
Representative distance distributions between (i, i+4) spin label pairs in the R1; 286/290 (A) and R3; 300/304 (B) segments. The distributions, consisting of the probability of given a distance P(r), were obtained from fits to the EPR spectra as detailed in the Materials and methods and shown in Supplementary Figures S5 and S7A. Ca2+/CaM binding to R3 induces conformational changes along the entire regulatory segment evidenced by changes in average distance and breadth of the distribution (A, red trace) and increased dynamics of the R1 segment illustrated by sharper EPR lineshapes at sites 287 and 282 (C) and increases in the inverse correlation times (D).

