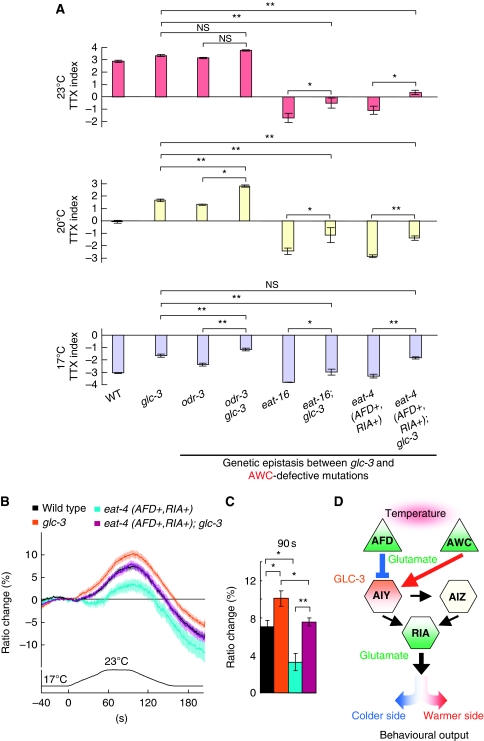
Figure 7.
Effect of AWC defect on glc-3(ok321) mutants. (A) The population thermotaxis assays of AWC-defective mutants and glc-3 mutants in the background of abnormal neural signalling in AWC; n=3 or more assays. Error bar indicates s.e.m. Single asterisk, double asterisk, and NS indicate P<0.05, P<0.01, and P>0.05, respectively, in post hoc Tukey–Kramer tests for a comparison of each genotype. (B, C) In vivo calcium imaging of AIY in eat-4 (AFD+, RIA+); glc-3 and in each single mutant. (B) Ratio change of yc3.6 in AIY according to temperature change. (C) The average of ratio changes to temperature stimuli at 90 s regarding the results shown in B; (B, C) n=22 or more animals. Error bar indicates s.e.m. Single and double asterisk indicate P<0.05 and 0.01, respectively, in Steel–Dwass tests for a comparison of each genotype. (D) A model for glutamatergic neurotransmission in the thermotaxis neural circuit. AFD, AWC, and RIA release glutamate in EAT-4-dependent manner (green). GLC-3 acts in AIY (orange). EAT-4-dependent glutamate signals from AFD inhibit the activity of AIY through activation of GLC-3 inhibitory glutamate receptors, and induce eventual migration to colder side (blue). By contrast, EAT-4-dependent glutamate signals from AWC stimulate the activity of AIY, and induce eventual migration to warmer side (red).

