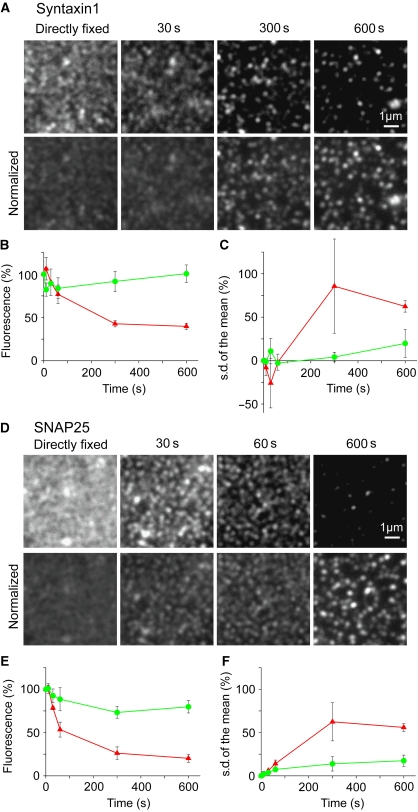
Figure 3.
Decrease in immunostaining intensity correlates with redistribution of membrane proteins into more clustered patterns. (A, D) Syntaxin (A) and SNAP25 (D) stainings on membrane sheets incubated with 54 μM Ca2+ for times as indicated. (Upper panels) Images at the same scaling, illustrating that staining becomes dimmer over time. (Lower panels) In order to illustrate that dimming correlates with a higher degree of protein clustering images were background subtracted, and mean intensity normalized to the mean intensity of the image from the directly fixed membrane sheet. Presenting images at the same scaling illustrates that the available signal becomes more punctate upon Ca2+ treatment. For syntaxin (B, C) and SNAP25 (E, F) mean staining intensity (B, E) and pixel s.d. of the mean (normalized to mean background subtracted intensity, related to the 0 s value) (C, F) were plotted against incubation time without Ca2+ (green traces) or with 54 μM Ca2+ (red traces). Values are means±s.e.m. (n=3 independent experiments; 26–74 membrane sheets were analysed for each condition in one experiment).

