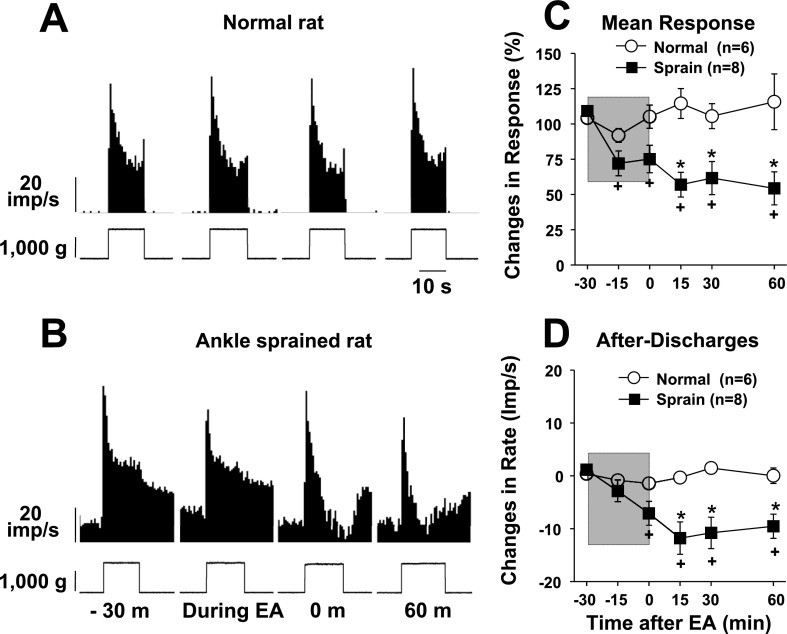
Fig. 4.
Changes in dorsal horn neuron responses to compression applied to the ankle joint before and after EA in normal rats (n = 6) and ankle-sprained rats (n = 8). The EA period is indicated by the shaded boxes. A and B: examples of recorded activity evoked by compression applied to the ankle joint (bottom traces show changes in the compression force) in a normal rat (A) and an ankle-sprained rat (B). C and D: summary data of six normal rats and eight ankle-sprained rats. *Values were significantly different from the normal group; +values were significantly different from the pre-EA value (−30 min).

