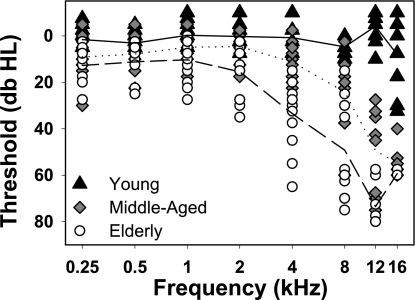
Fig. 1.
Pure-tone audiograms for subjects in each age group. Each symbol represents a listener's hearing level threshold (in dB HL, right and left ear averaged) at a particular pure-tone frequency. Solid, dotted, and dashed lines indicate group average thresholds as a function of frequency within the young, middle-aged, and elderly group, respectively.

