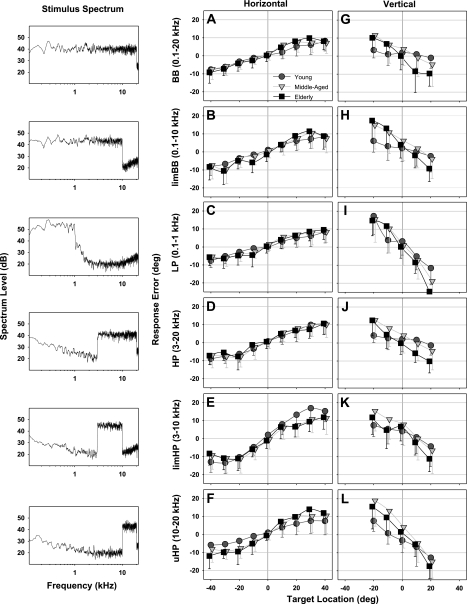
Fig. 4.
Averaged horizontal (center) and vertical (right) sound localization response error (degrees) for the 6 wideband targets as a function of target location in young (N = 19; dark grey circles), middle-aged (N = 11; light grey triangles), and elderly (N = 12; black squares) listeners. Error bars indicate SD around mean error. Symbols are slightly offset on the x-axis for graphic clarity. Stimulus spectra (left) at the subject's head are also shown for the respective wideband targets. Low-frequency energy visible in the spectra in the bottom 3 plots reflects background noise in the test room. BB, broadband; limBB, limited broadband; LP, low-pass; HP, high-pass; limHP, limited HP; uHP, ultra HP.

