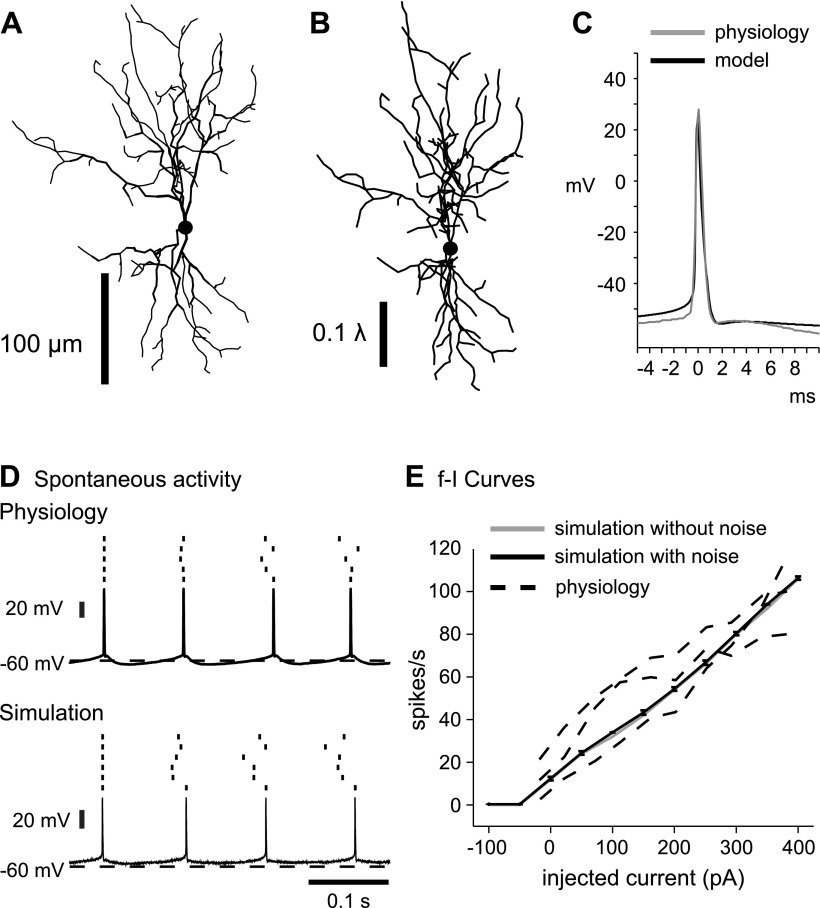
Fig. 1.
Match of deep cerebellar nuclei (DCN) model neuron to physiological properties. A: morphological reconstruction of the DCN neuron used in model simulations. B: the same morphological reconstruction of the DCN neuron in A, redrawn to electrotonic scale. C and D: there is a good match in spike shape (C) and afterhyperpolarization properties (D) between a physiological slice recording and a sample simulation. E: spike frequency increases in response to current injection pulses similarly for the model neuron (solid) and 3 recorded neurons (dashed). Note that the addition of noise had virtually no effect on the frequency-intensity (f-I) curve of the model. Error bars for simulations with noise (n = 6) representing 1SD are plotted but due to their small size are mostly within the line width of the graph.

