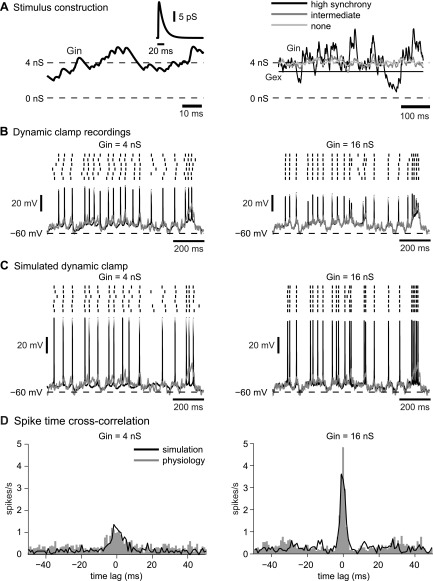
Fig. 3.
Match of dynamic clamp simulations to slice recordings. A: the dynamic clamp inhibitory conductance waveform (Gin) is the sum of 400 inhibitory input conductances over time. The timing of inputs is stochastic and composed of single inhibitory postsynaptic conductances with a double-exponential time course and a peak of 17.2 pS (inset), which results in a mean Gin of 4 nS. Inhibitory conductance waveforms for higher levels of synchronicity have larger transient fluctuations around the mean. Excitatory conductance (Gex) is constant at a level of ¾ that of mean Gin. B: sample recordings of dynamic clamp voltage traces are shown for high input synchronization and 2 levels of inhibition. For a mean Gin of 16 nS, the subthreshold membrane potential (solid) closely follows the synaptic driving force (Esyn; shaded). C: voltage traces from the computer model with the exact same synaptic inputs applied to the soma, simulating dynamic clamp. D: there is a more prominent central peak in the spike-time cross-correlogram for a Gin of 16 nS than for a Gin of 4 nS, indicating greater spike-time precision at higher input gains. The spike-time cross-correlograms are very similar between the model (solid) and the experimental data (shaded). The percentages of spikes that were aligned within a window of ±1 ms for the sample neuron shown and the model, respectively, were 12 and 11.5% for a Gin of 4 nS and 42 and 38.7% for a Gin of 16 nS.

