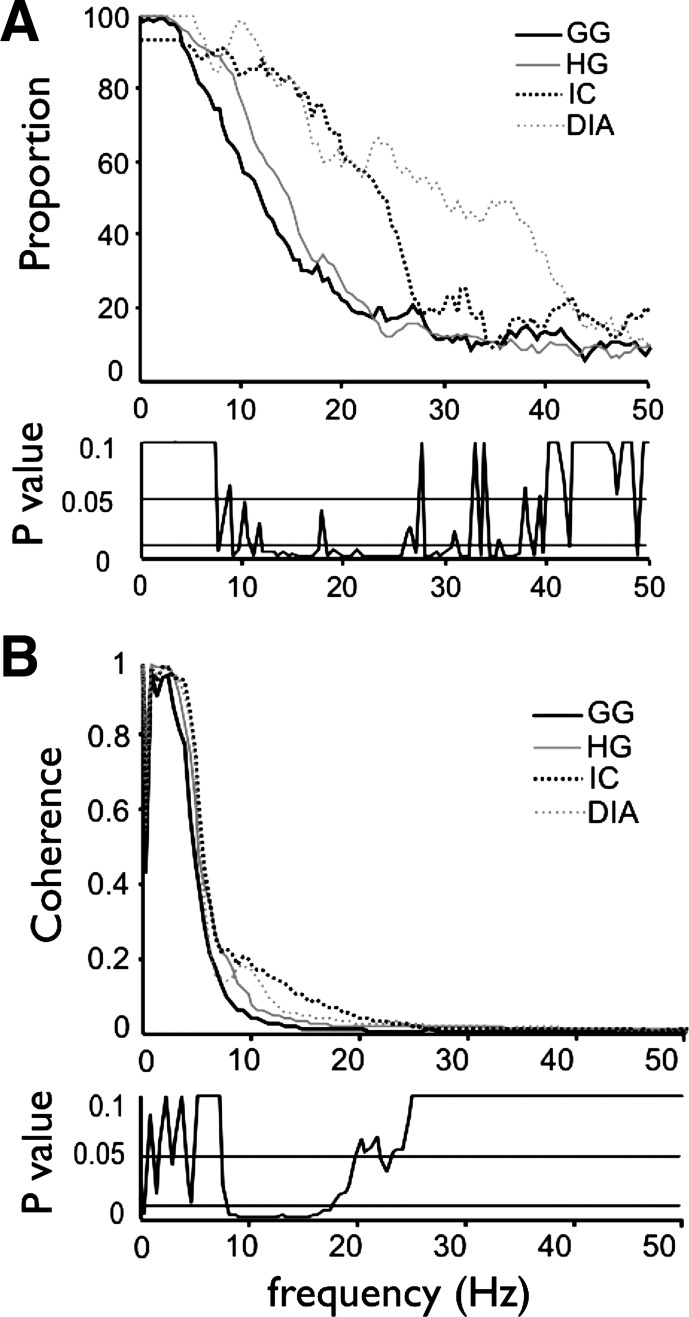
Fig. 3.
Proportion of coherent motor unit pairs and average coherence magnitude for all within-muscle comparisons. A: proportion of within-muscle motor unit pairs showing significant coherence at each frequency, for all 4 muscles. The proportion of coherent motor unit pairs in each of the 4 muscles and at each frequency was compared statistically (see methods), and the results of this analysis are depicted as P values in the lower section of A. B: average coherence magnitude between motor unit pairs within each of the muscles, with the P values derived from one-way ANOVA located beneath the coherence data. There were significant differences in coherence magnitude across the 9–20-Hz bandwidth.

