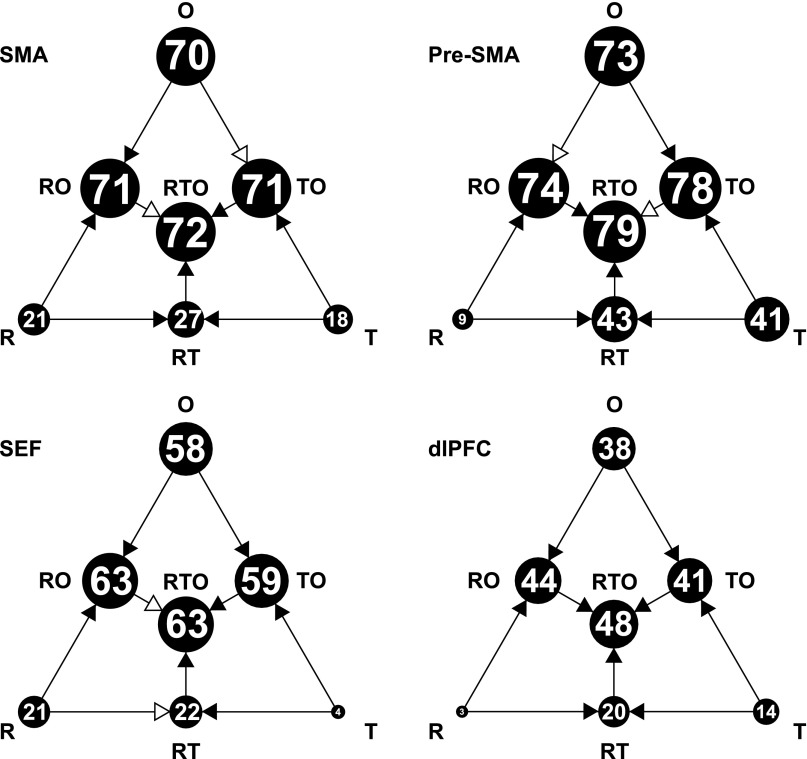
Fig. 10.
Results of linear regression analyses with the rank index in the serial action task as a dependent variable and with three regressors in all seven possible combinations. The regressors were the reward index from the variable reward task (R), the time index from the long delay task (T), and the rank index from the serial object task (O). The percentage of explainable variance captured by each model is indicated by the area of the corresponding disk and the number within it. The models formed a nested hierarchy. For each step from a simpler model to a fuller model, we used a partial F-test to determine whether the increase in variance explained was significantly greater than would be expected simply from adding another free parameter. Arrows with filled heads indicate cases in which the improvement was statistically significant (α = 0.05); arrows with open heads indicate cases in which the improvement was not statistically significant.

