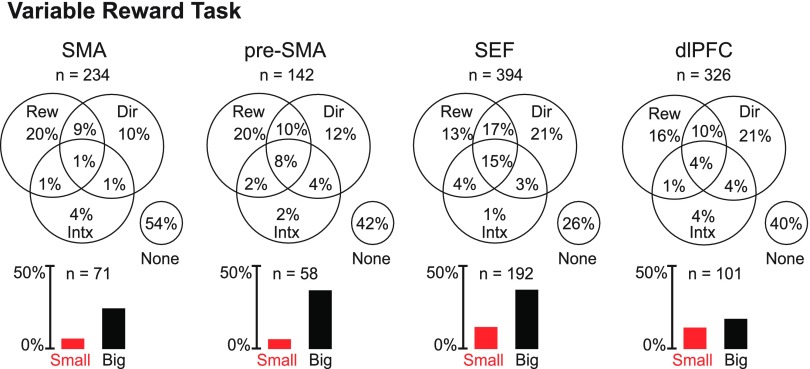
Fig. 5.
Each Venn diagram shows the proportion of neurons in a given area with main effects of reward (Rew) and direction (Dir) and interaction effects involving both (Intx). Each bar histogram shows the proportion of neurons in a given area that exhibited significant reward selectivity and favored the small (red) or big (black) reward.

