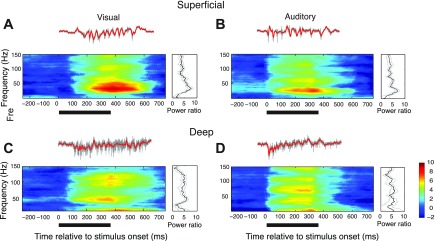
Fig. 2.
Gamma oscillations evoked by visual and auditory stimuli in the superficial and deep layers. Local field potential (LFP) responses to a vertically moving dot (speed: 15°/s, left) or broadband noise bursts (right). The stimuli were presented at the center of the receptive field of the site. Gray traces show unfiltered activity; red traces show LFP (see materials and methods). A: average R-spectrogram measured in the superficial layers. Power relative to baseline (in dB, see materials and methods) is plotted as a function of frequency and time relative to stimulus onset, averaged over 10 repetitions of the stimulus. Color bar indicates power relative to baseline (in dB). The dark bar under the spectrogram indicates duration of stimulus presentation (onset at 0 ms). Right: average induced LFP power (R-spectrum) at 260 ms. Gray lines indicate standard error across repetitions. B: same as in A, for an auditory stimulus. Right: average induced LFP power at 180 ms (the earlier time for computing induced power is on account of the earlier onset of the auditory response). C: same as in A, for a site recorded in the deep layers. D: same as in C, for an auditory stimulus.

