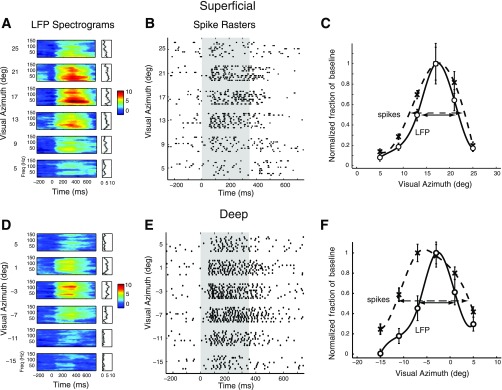
Fig. 4.
Spatial tuning of induced gamma LFP power and spike rates at individual sites in the superficial and deep layers. A: R-spectrograms showing the modulation of gamma LFP power for a representative site in the superficial tectum when a visual stimulus was presented at different azimuthal locations at the best elevation of the site (as measured from spike rates) for the site. Other conventions are described in Fig. 2. B: spike rasters, recorded at the same site as in A, showing tuning in spike rates to stimulus location. Shaded gray area corresponds to stimulus presentation. Note that spikes occurred in bursts of 4–5 spikes. C: gamma LFP tuning curve (○), and cubic-spline fit (solid line), as well as spike rate tuning curve (crosses), and cubic spline fit (dashed line). Each tuning curve was normalized to its maximum so that the full-width at half-max occurred at an ordinate value of 0.5. D: same as in A, for a site recorded from the deep layers. E: same as in B, for the same deep layer site as in D. F: same as in C, for the same deep layer site as in D.

