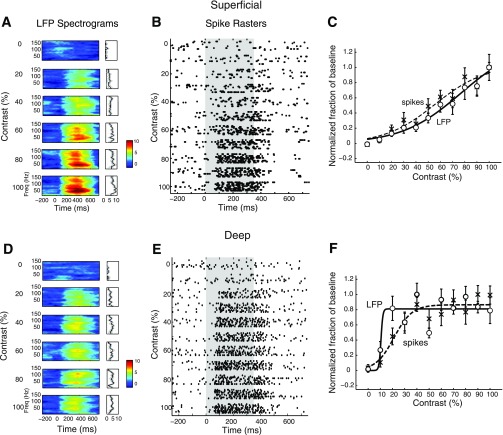
Fig. 6.
Contrast-response functions for induced gamma LFP power and spike rates at individual sites in the superficial and deep layers. A: R-spectrogram for a representative superficial layer site showing the increase in gamma LFP power in response to increasing visual stimulus contrast presented at the center of the receptive field. Other conventions are as in Fig. 4. B: spike rasters showing spike responses recorded at the same superficial site as in A. Other conventions are as in Fig. 4. C: gamma LFP contrast-response (○) and sigmoidal fit (solid line), as well as spike rate contrast-response (crosses) and sigmoid fit (dashed line). Each curve was normalized to its maximum to facilitate comparison of the respective transition ranges (the contrast range over which gamma LFP power changed from 10% to 90% of its maximum range). D: same as in A, for a representative site in the deep layers. E: same as in B, for the same deep layer site as in D. F: same as in C, for the same deep layer site as in D.

