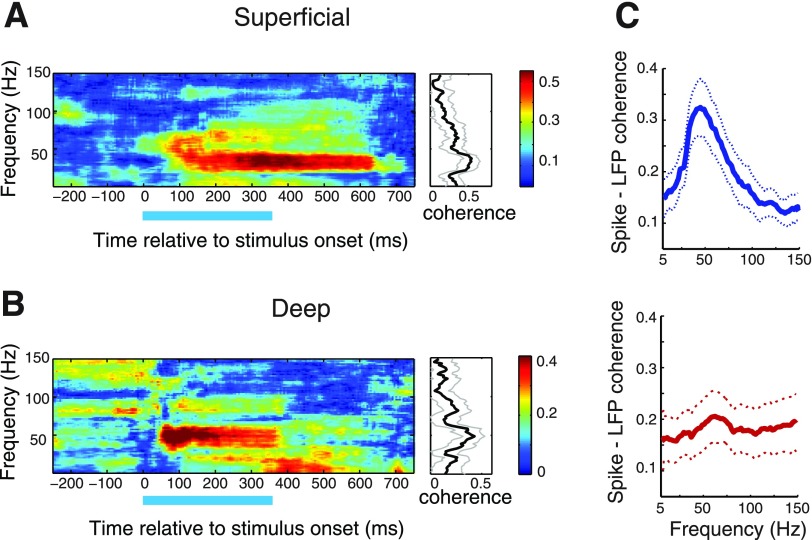
Fig. 9.
Spike-field coherence in the superficial and deep layers. A: spike-field coherogram for an individual site in the superficial layers computed from responses to a visual stimulus (duration indicated by bar) at the center of the spike-receptive field. Color bar indicates coherence values. Right: coherence during stimulus presentation. Gray lines: 95% Jackknife confidence intervals. Other conventions are as in Fig. 2. B: same as in A, for an individual site in the deep layers. C: population average of the visually induced spike-field coherence in the superficial (blue, top), and deep (red, bottom) layers. Region between dotted lines: 95% confidence intervals across sites. Other conventions are as in Fig. 2.

