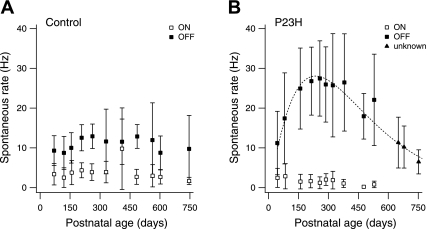
Fig. 4.
Spontaneous activity in ON and OFF ganglion cells. A: spontaneous firing rate measured in ganglion cells of control retinas as a function of animal age. Each data point represents the average rate measured in 8 ± 1 ON cells (n = 87 cells) and 13 ± 1 OFF cells (n = 133 cells). Error bars indicate SD. B: spontaneous firing rate measured in ganglion cells of P23H retinas. Each data point represents the average rate measured in 9 ± 2 ON cells (n = 95), 18 ± 2 OFF cells (n = 175), and 15 ± 1 unidentified cells (unknown; n = 47). Error bars indicate SD. Dashed line is a fit function to all non-ON cell data points (see methods).

