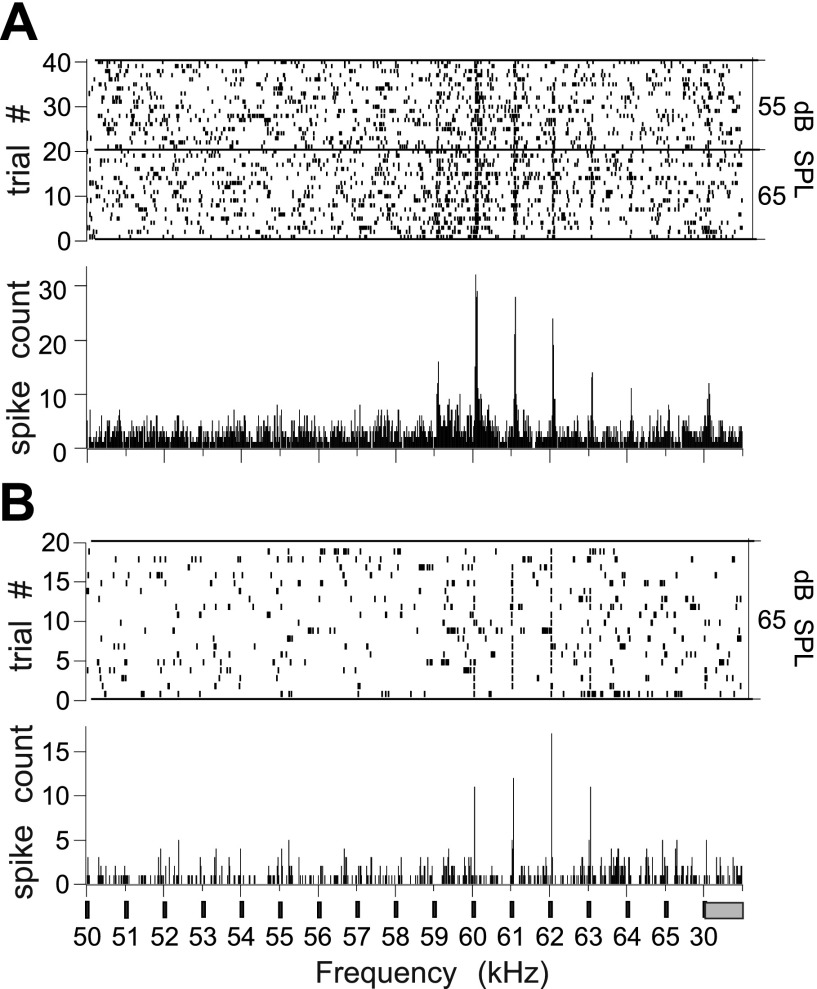
Fig. 2.
Raster plots (top) and Peristimulus time histogram (PSTH) (bottom) summed for 40 trials to show the frequency tuning to the CF2 (centered at ∼59 kHz) in a tone pair (CF1/CF2) of 2 BLA neurons, where CF is constant frequency. Neuron in A has a higher rate of spontaneous activity than the one in B. The 30-ms tone bursts were presented at a rate of 2 per second. Final stimulus was a standard tone burst at 30 kHz corresponding to the CF1 of the echolocation pulse. Bin width = 10 ms.

