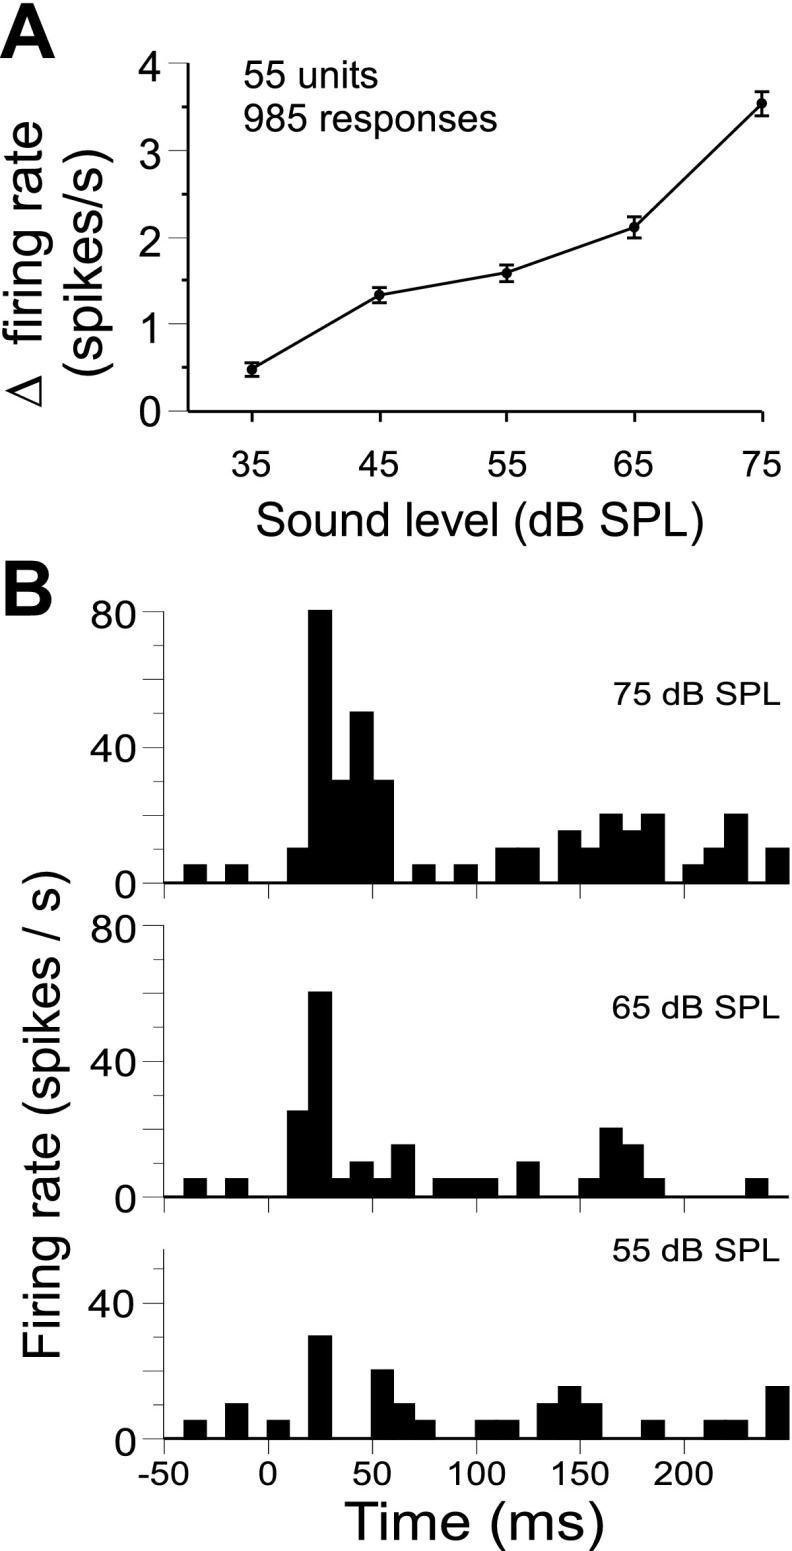
Fig. 7.
Dependence of mean firing rate on stimulus amplitude. A: changes in the mean firing rate were averaged across excitatory call responses for each sound level. On average, response strength increased with increasing sound amplitude [F(4,984) = 67.3, P < 0.001 one-way ANOVA]. B: an example of call response matching the average trend shown in A. Individual PSTHs are generated from 20 presentations of the single arched frequency modulation at each of the top 3 stimulus amplitudes as indicated.

