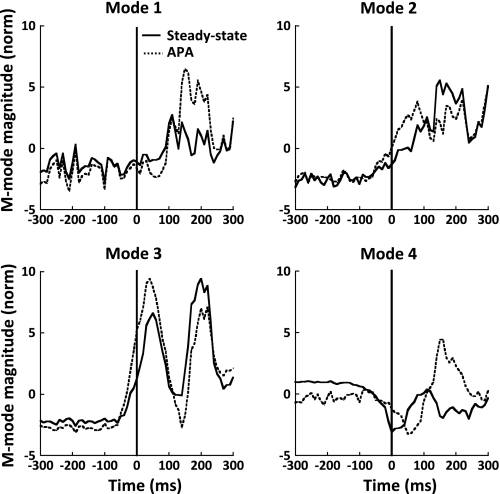
Fig. 4.
Time profiles of the 4 M-mode magnitudes, shown for a typical subject (S1), when calculated with loadings from the steady-state phase (solid line) and the APA phase (dashed line) for the SP condition. Because no changes are expected before 300 ms prior to t0, data are only shown from −300 ms until +300 ms. norm, Normalized.

