Fig. 2.
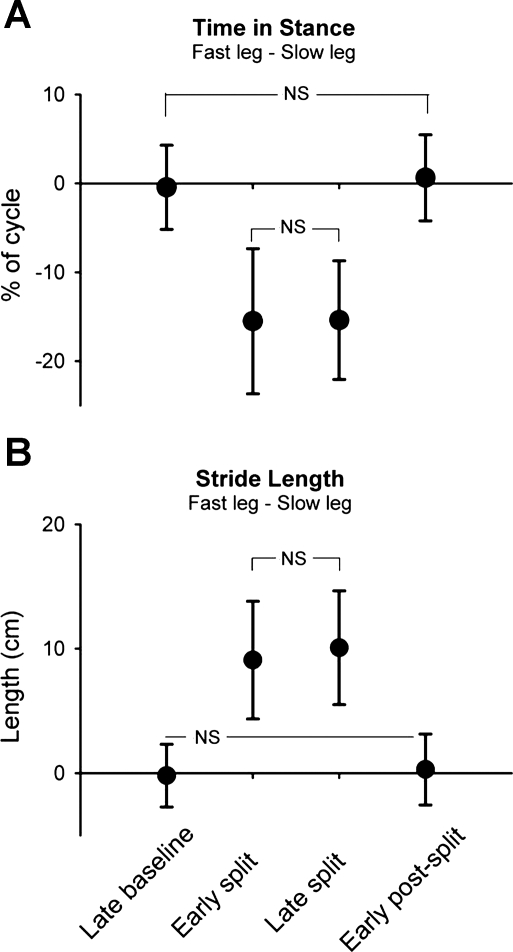
Stance time and stride length. Group data (n = 27) are shown for time in stance (expressed as % of step cycle; A) and stride length (in cm; B). Data points represent mean values (from 40 steps) for each time period with error bars (SD). NS, not statistically significant. All other comparisons are significant (P < 0.008, Bonferroni).

