Fig. 3.
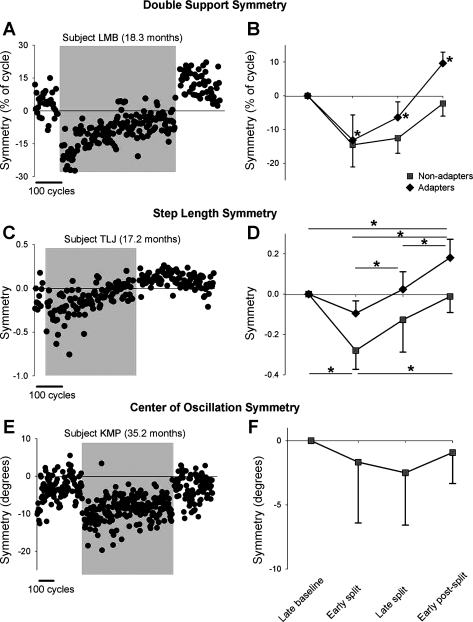
Symmetry of double support time, step length, and center of oscillation. A and C show data from single subjects who showed adaptation in double support and step length, respectively. E shows data from a single subject who did not show adaptation in center of oscillation. Data points represent means of 3 consecutive steps. Shaded region indicates the split-belt period. B, D, and F show group data for the adapters (solid diamonds) and nonadapters (solid squares) in measures of double support (n = 23 and 3, respectively), step length (n = 12 and 7, respectively), and center of oscillation (n = 0 and 7, respectively). Values are means ± SD, after the asymmetry in baseline was removed (see methods). In B: *P < 0.008, significantly different from other time periods, including baseline. In D: *P < 0.008, significant difference, with results for adapters and nonadapters shown at top and bottom of graph, respectively.

