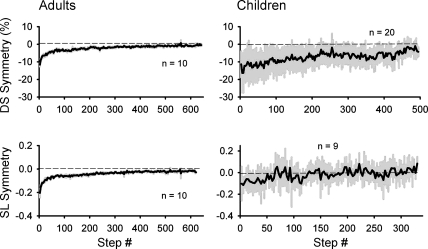
Fig. 5.
Time course of adaptation. Group data show means (solid line) across subjects for the period of split-belt walking. Double support symmetry (top) and step length symmetry (bottom) for both adults (left) and children (right) are shown, with 1SD represented by shading. Only adapters (i.e., those showing significant aftereffects) are included.

