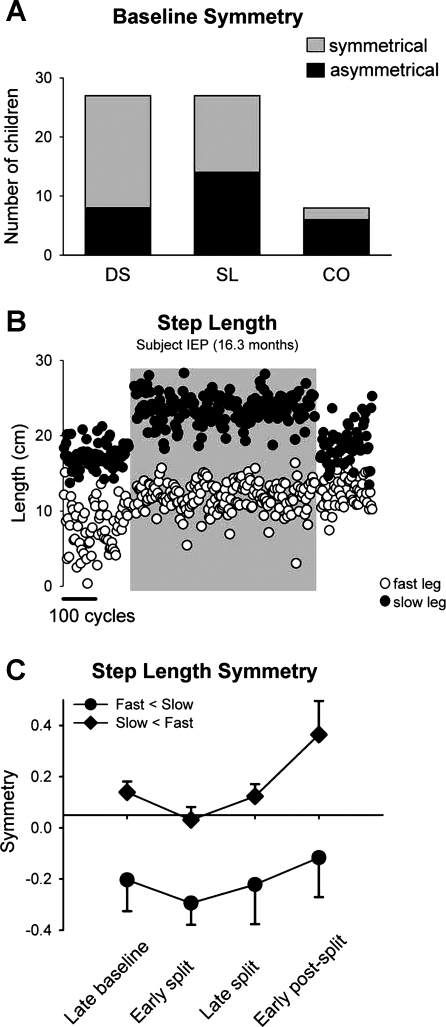
Fig. 7.
Asymmetries. A: number of children that showed symmetrical (shaded bars) and asymmetrical (solid bars) walking with respect to double support (DS), step length (SL), and center of oscillation (CO). B: step length data from a single subject who showed an asymmetry during the baseline period (fast step length < slow step length). Open and solid circles represent the fast and slow step lengths (mean of 3 steps), respectively. Shaded region indicates the split-belt period. C: values are means ± SD of step length symmetry (mean late baseline values not subtracted) for children who 1) showed asymmetries in step length at baseline, 2) showed an error in step length symmetry during early split, and 3) showed adaptation (total of 5 children). Two children had fast < slow asymmetry (solid circles) (i.e., step length of the fast leg was shorter), and 3 children had slow < fast asymmetry (solid diamonds) (i.e., step length of the slow leg was shorter).

