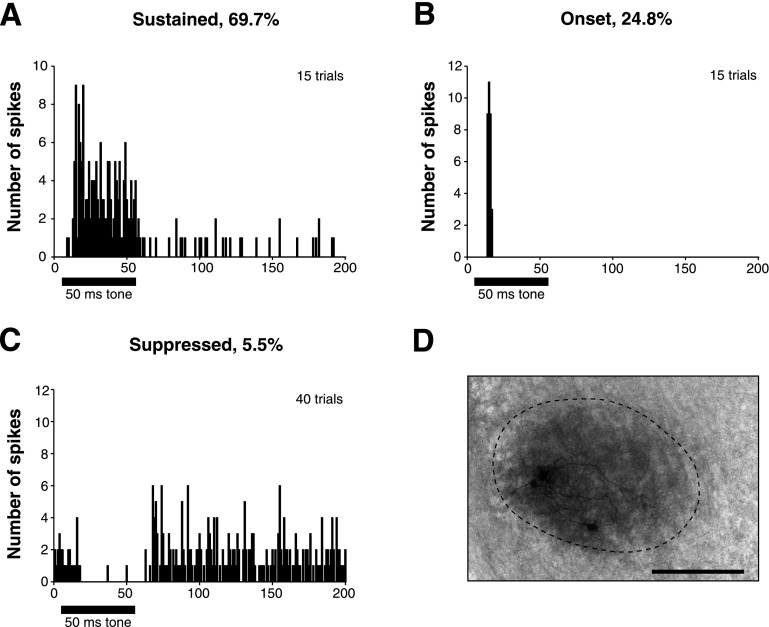
Fig. 1.
Superior olivary nucleus (SON) cells have diverse responses to tone stimulation. A: peristimulus (PST) histogram of a cell with a sustained response, showing the typical peak initial response followed by tonic firing throughout the duration of the stimulus. B: PST histogram of a cell with an onset response, which typically fires 1 or 2 spikes only at the beginning of a stimulus tone. C: PST histogram of a suppressed cell, which have high spontaneous rates that are reduced or eliminated during a tone stimulus. D: recording sites were confirmed by iontophoresis of neurobiotin from the recording electrode following several experiments. In this case, neurobiotin labeled just a few cells within the SON. Scale bar = 200 μm.

