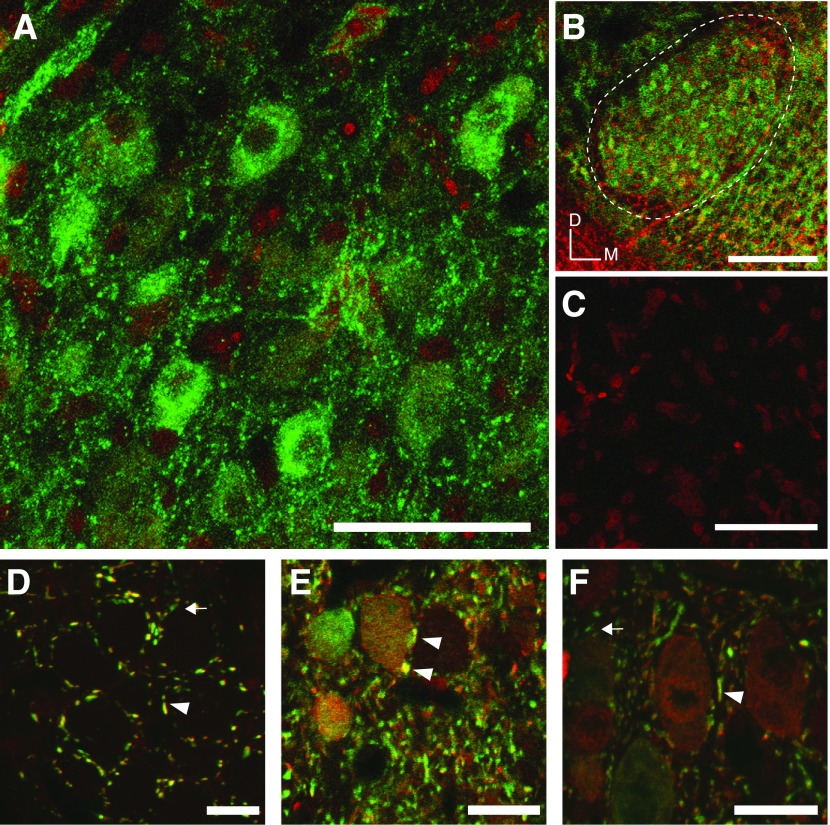
Fig. 10.
Immunohistochemistry of glycinergic signaling in the SON. A-C: images of coronal sections of a P7 chicken SON: images are maximum intensity projections from confocal z-stacks through 50 μm slices. A: GlyR immunoreactivity (green) is abundant among SON somas and processes. Nissl stain is shown in red. B: lower magnification image from the same SON as in A, GlyR is broadly distributed throughout the SON. Dashed line denotes the borders of the SON. Orientation bars indicate dorsal (D) and medial (M). C: immunofluorescence for GlyR is absent in tissue processed without primary antibody (Nissl staining shown in red). D–F: staining for neurotransmitters glycine (red) and GABA (green), images are single confocal sections from a P23 chicken brainstem sectioned at 30 μm. D: GABA/glycine immunostaining in nucleus magnocellularis (NM) show singly labeled GABA terminals arrow and robust double-labeled terminals arrowheads. Somatic staining was completely absent in NM. E and F: SON neurons also have both doubly labeled GABA/Gly immunopositive terminals as well as singly labeled GABAergic terminals. In contrast to NM, SON somas are differentially immunopositive for GABA or glycine or both. Scale bars: A and C = 50 μm, B = 200 μm, and D–F = 20 μm.

