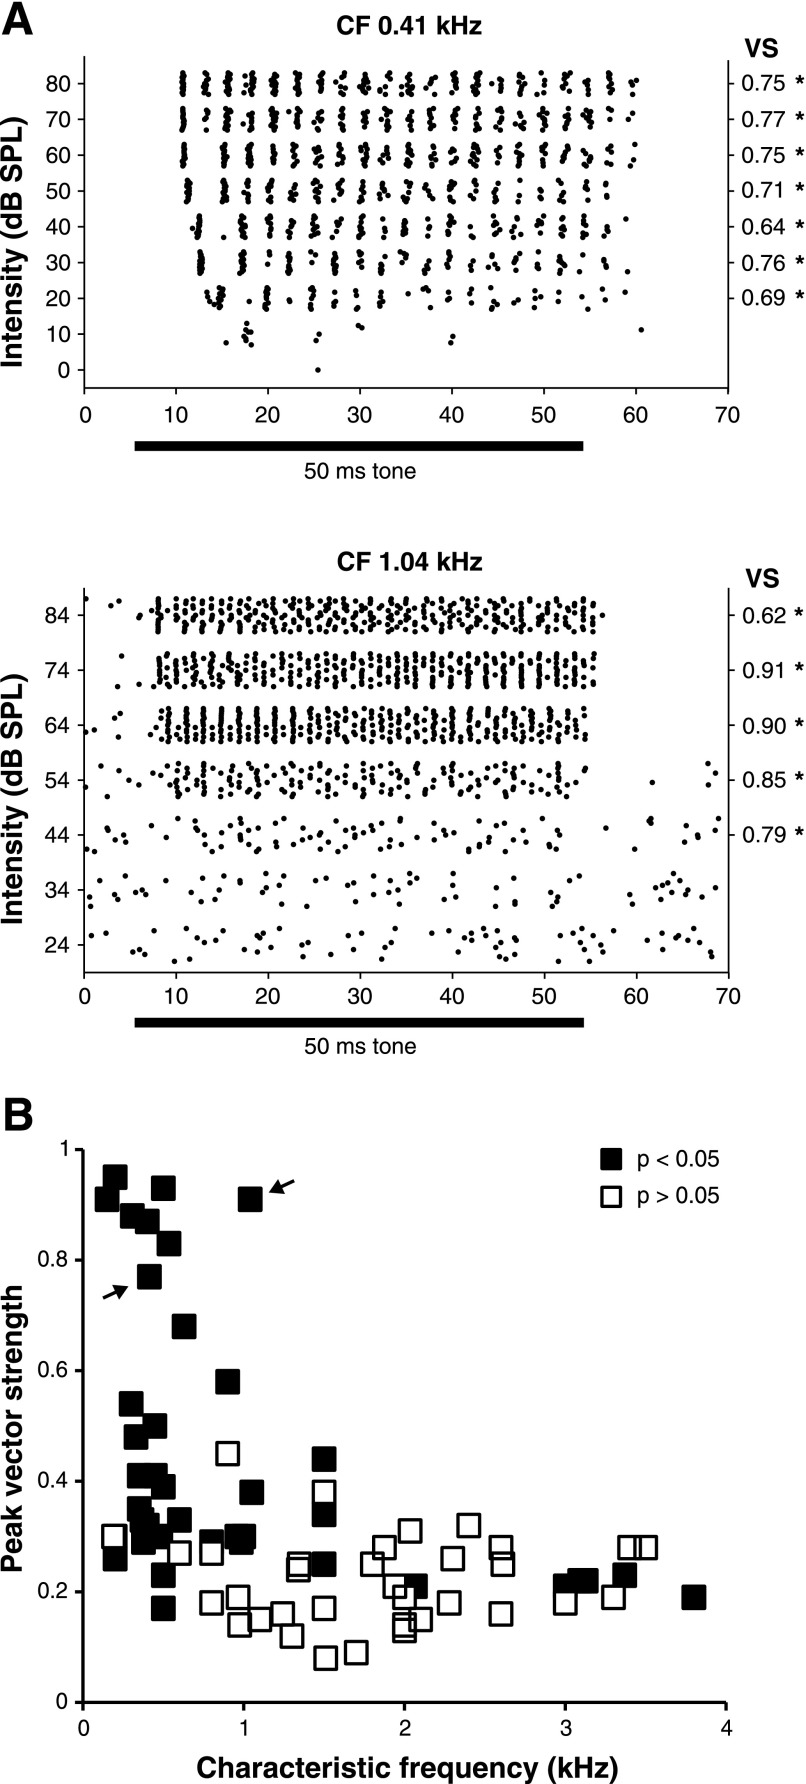
Fig. 4.
Some SON neurons respond to acoustic stimulation with phase-locked discharges. A: raster plots of responses to CF tones for 2 SON cells that demonstrated high vector strength values. Values were computed for responses at all suprathreshold intensities for neurons with robust sustained responses. *P < 0.05 by Rayleigh test (see materials and methods). B: distribution of peak vector strength re: CF. Many of the sustained cells with CF <1.5 kHz have peak vector strength values 0.3 or higher. ■: P < 0.05 by Rayleigh test (see materials and methods). Arrows denote the peak vector strengths of the neurons shown in A.

