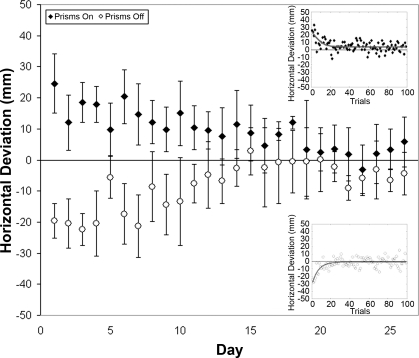
Fig. 2.
Mean horizontal deviation for the first 5 reaches with prisms donned and for the first 5 reaches after removal of prism glasses for each day of the initial 26-day training period in monkey C. Positive values on the y-axis represent deviations to the right of target, and negative values represent deviations to the left of target. Top right inset demonstrates horizontal deviation for each trial on day 1 of prism exposure (prism on). Bottom right inset demonstrates horizontal deviation for trials immediately after removal of prisms on day 1 (no prism).

