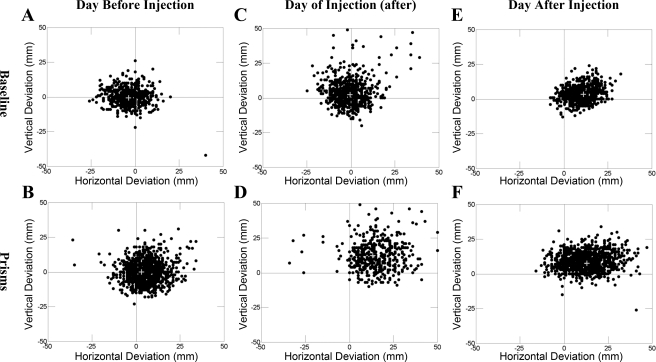
Fig. 4.
(x,y) touch points (relative to target appearance) shown separately for no-prism (top) and prism (bottom) trials. Data are shown for all completed trials. A and B: trials completed for the day before lidocaine inactivation of cerebellar cortex in monkey G (injection E). C and D: data for only trials immediately following injection of cerebellar cortex with lidocaine. E and F: relative touch data for the day following inactivation of cerebellar cortex.

