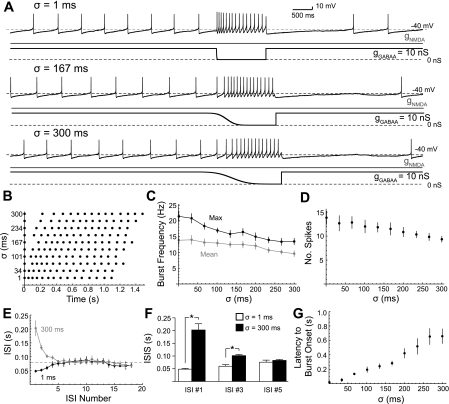
Fig. 6.
Disinhibition bursts change in frequency and shape with asynchronous removal of the GABAA conductance. A: concurrent NMDA and GABAA conductance ramps (3:1 ratio) were applied to a dopaminergic neuron in a representative example (as in Fig 1). A total conductance of 40 nS (gNMDA = 30 nS; gGABAA = 10 nS) was achieved at the end of the ramp and maintained. At 30-s intervals, gGABAA was removed according to the complementary cumulative distribution function, which describes the asynchronous removal of a population of tonically activated GABAA receptors. The standard deviation parameter of that function is described by σ. A raster plot of disinhibition spiking as sampled in A is shown in B. The maximum (solid) and mean frequency (shaded) of the burst (C) as well as the number of spikes in the burst (D) decreased significantly with increasing σ (P < 0.05, n = 6). E–G: the shape of the disinhibition bursts changed with increasing σ; changes in the ISI as the burst progressed in all 6 cells. With small σ (i.e., more synchronous gGABAA removal), disinhibition bursts showed a progressive increase in the ISI of each spike in the burst (B and E, solid). With large σ (more asynchronous gGABAA removal), disinhibition bursts showed a progressive decrease in the ISI of each spike in the burst (B and E, shaded). The first ISI <80 ms (dashed line in C) defines the onset of the burst. F: there was a significant increase in the ISI up to ISI #3 for σ = 1 ms compared with σ =300 ms (P < 0.05, n = 6). G: the latency at which the burst began increased with σ (P < 0.05, n = 6).

