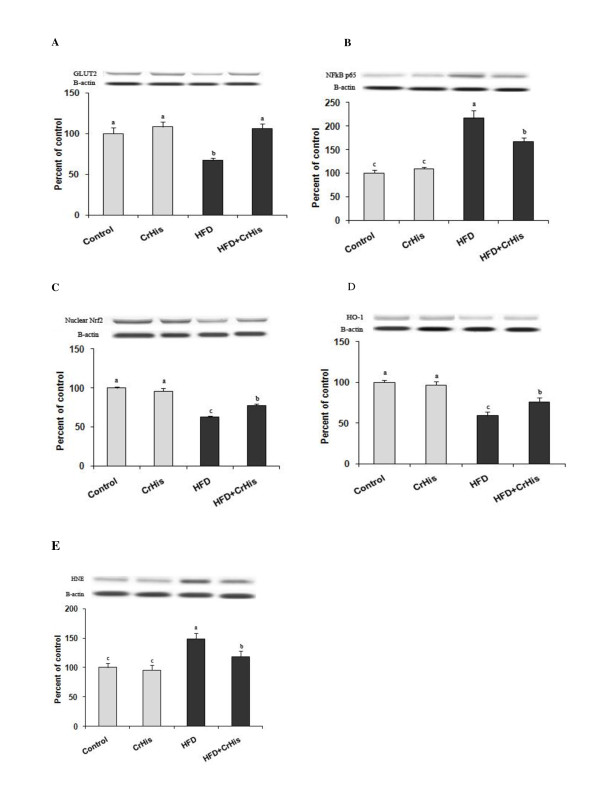
Figure 1.
Effect of HFD and CrHis on liver GLUT-2 (A), NFκB (B), Nrf2 (C), HO-1 (D) and HNE (E) expressions in rats fed high fat diet. The intensity of the bands was quantified by densitometric analysis and normalized with corresponding β-actin. Values are means ± standard error of the mean. Western blot analysis was repeated at least 3 times (n = 3) and a representative blot is shown. Data points with different superscripts are significantly different at the level of p < 0.05 by Fisher's multiple comparison test.

