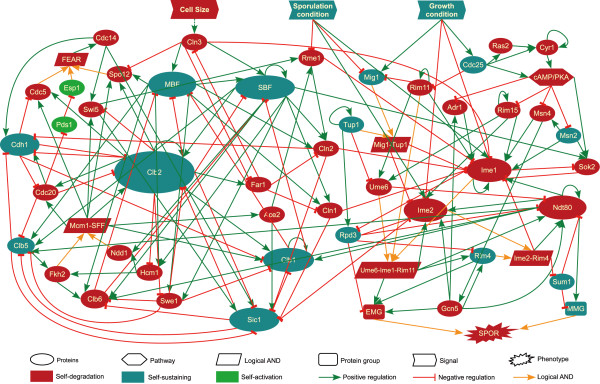
Figure 1.
Genetic network of budding yeast regulating cell cycle and sporulation. Positive and negative regulations are represented by green arrow and red link with bar, respectively. Orange arrows represent inputs for a logical AND node. Self-degradation, self-sustaining and self-activation nodes are colored in red, blue and green, respectively. See also Additional file 1, Table S1.

