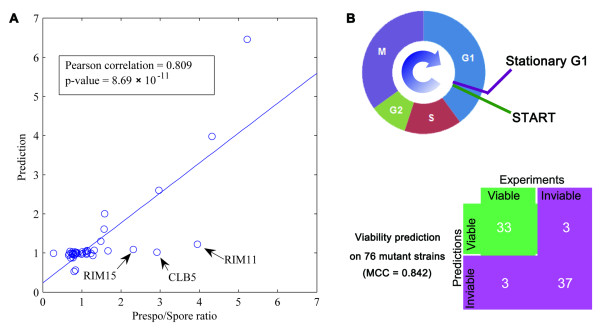
Figure 3.
Predicting phenotypes from the network. (A) Correlation between the experimental measured (Prespo/Spore ratios) and the predicted sporulation efficiency. (B) Predicting viability of 76 mutants (36 viable and 40 inviable). Strains going through START, G1, S, G2, M, G1 and ending at stationary G1 are predicted as viable. See also Additional file 2, Table S2.

