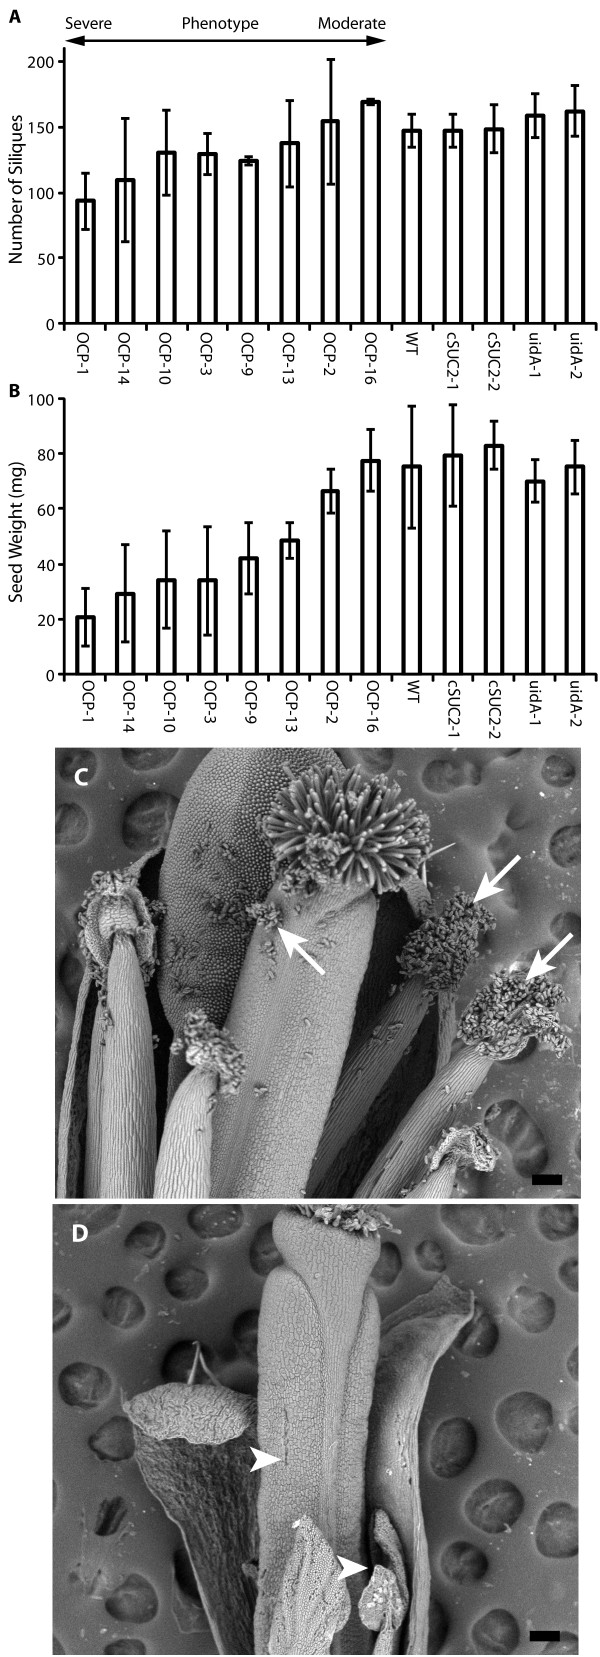
Figure 3.
Fecundity analyses of representative OCP lines relative to WT, cSUC2 and uidA control lines. (A) Number of siliques per plant on the indicated lines at maturity. (B) Seed yield per plant harvested from indicated lines. OCP lines are arranged by phenotype severity and variation is expressed as standard deviation, n = 10. Scanning electron micrographs of a (C) WT flower showing copious pollen on anthers and carpels (arrows) and (D) OCP-1 flower with a dearth of pollen (arrowheads). Flowers in (C) and (D) are the same age with respect to opening (anthesis), some petals and sepals were removed to view the internal organs, scale bar is 100 μm.

