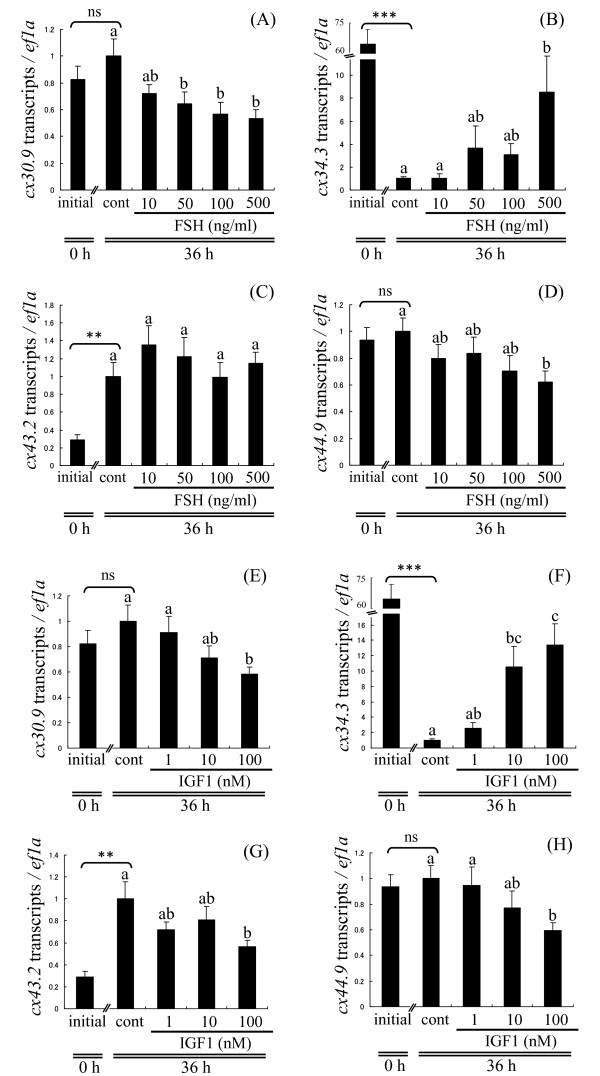
Figure 4.
Hormonal regulation of ovarian cx genes in vitro: culture experiment 1. Effects of varying FSH (10, 50, 100, or 500 ng/ml) and IGF1 (1, 10, or 100 nM) concentrations on levels of transcripts for cx30.9 (A, E), cx34.3 (B, F), cx43.2 (C, G), cx44.9 (D, H) in lipid droplet (LD)-stage follicles. Data are expressed as the mean ± SEM (n = 6) and presented relative to the expression of controls (cont; Time 36 h, no hormones, set to 1). Bars not sharing the same letter are significantly different (P < 0.05). Asterisks denote values that significantly differ between initial (Time 0, no hormones) and control (cont; Time 36 h, no hormones), **P < 0.01, ***P < 0.001. ns, no significant difference.

