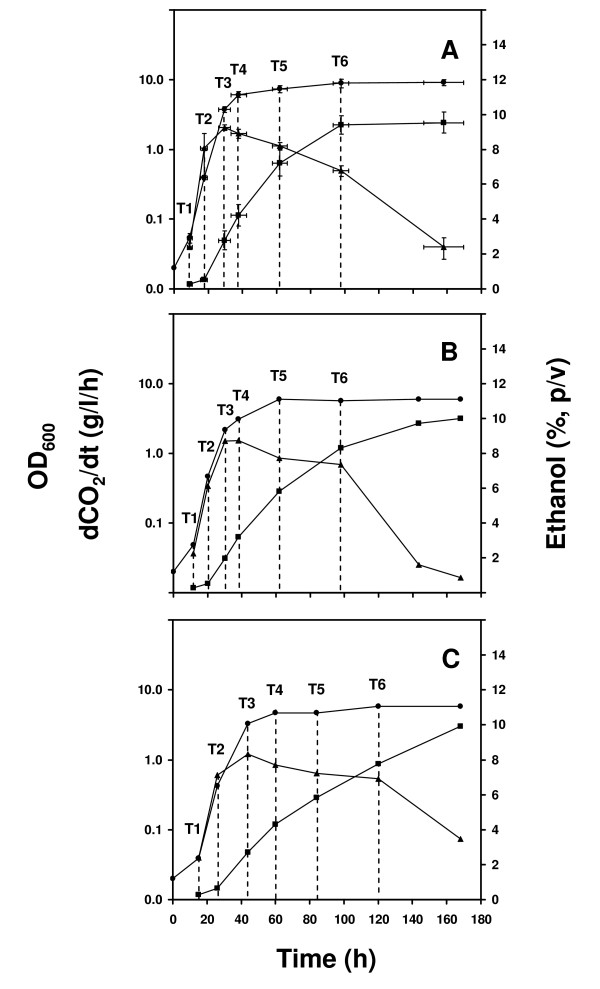
Figure 1.
Fermentation profiles of wild-type yeast strains. The fermentation profiles of the seven yeast strains used in this study are compared in respect to cell growth (OD600; -●-), CO2 production rate (dCO2/dt; -▲-) and ethanol concentration (%, p/v) (-■-): A) Averaged data for strains 06L3FF02, 06L6FF20, AEB Fermol Rouge, Lalvin ICV D254 and Lalvin EC-1118 (bars indicate standard deviations from the mean value represented); B) strain J940047; C) strain S288C. Vertical dashed lines identify the time points used for transcriptome profiling (see text for details).

