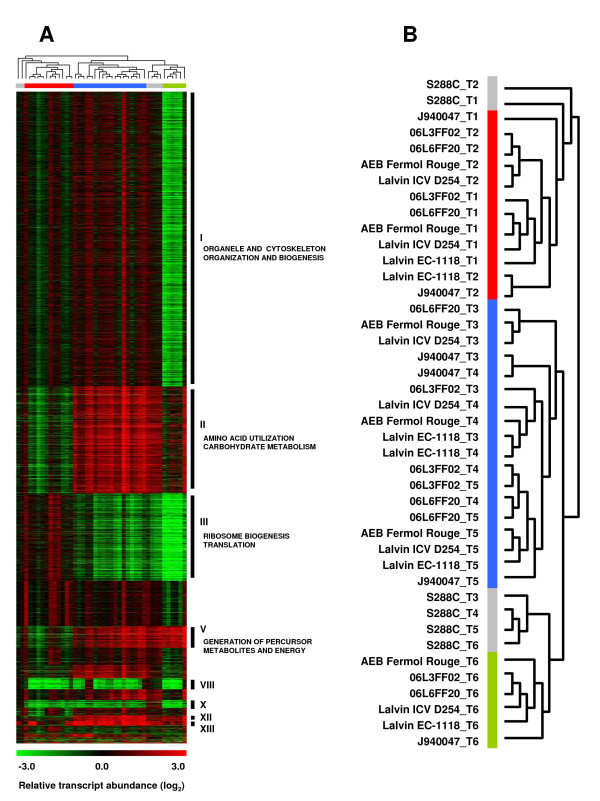
Figure 2.
Transcriptome profiles of yeast strains. A) Hierarchical clustering (Pearson correlation) of the relative transcript abundance profiles (log2 scale) of the yeast strains at different fermentation stages (see text for details) indicates similarities and differences in gene expression regulation along the fermentation process. B) Gene clusters highlight differences in the transcriptome profiles of cells in exponential growth (T1 and T2) and in stationary phase (T3 -T6). The gene expression profiles of strain S288C (Grey bar) were distinct form those of the other strains in all growth stages. The transcriptome profiles of strain J940047 were similar to those of the environmental and commercial strains but constituted, nevertheless, a distinct branch in the sub-groups defined by exponential growth profiles (Red bar), early stationary phase profiles (Blue bar) and late stationary phase profiles (Green bar). Thirteen groups of highly correlated gene co-expression patterns were identified by hierarchical clustering (see results section) and some of these clusters are highlighted in Panel A. Some of the enriched GO terms are indicated next to each cluster.

