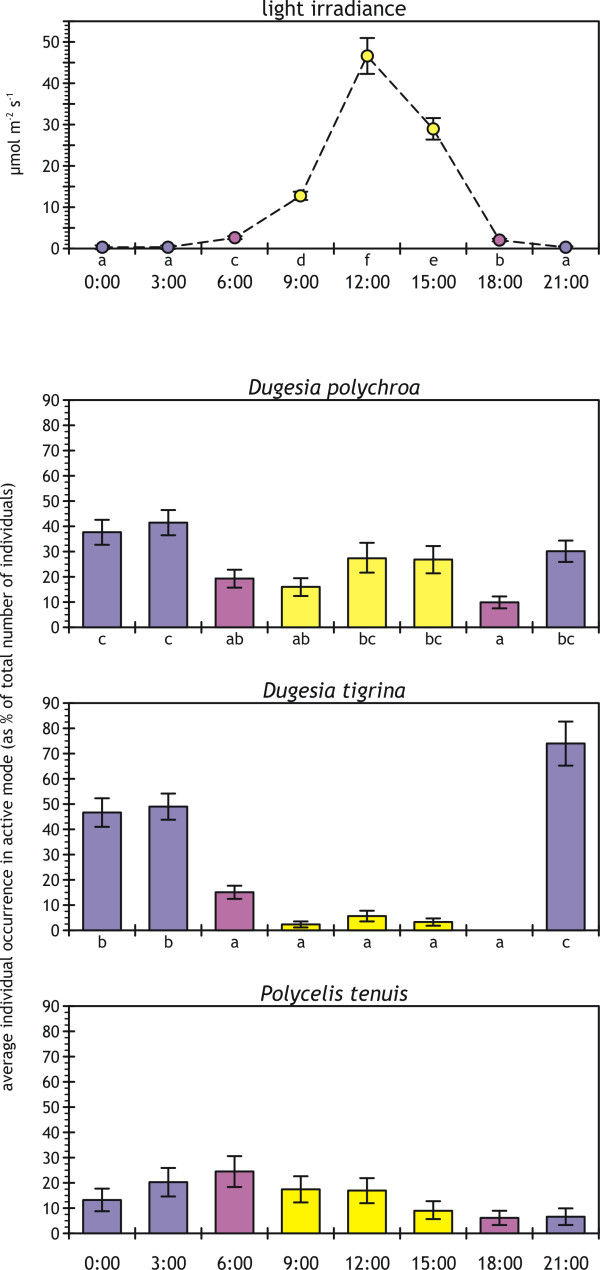
Figure 1.
Diel cycles in light irradiance and planarian activity. Light irradiance (top panel; average ± standard error; n = 10 for each time period) and average planarian individual activity (bottom three panels; average ± standard error; n = 12 for each time period) during the 24-h observation cycles, with observations carried out every 3 h starting at midnight on d1. Full daylight times are in yellow, nighttime hours in blue, and twilight hours in purple. Lower-case letters identify significantly different average values according to SNK tests (p ≤ 0.05) performed after significant one-way, type I ANOVAs on original (FD.polychroa = 5.746, p < 0.001; FD.tigrina = 42.766, p < 0.001; FP.tenuis = 2.041, p = 0.06; df = 7,88 for all) or log-transformed data (Flight = 278.783, p < 0.001, df = 7,72).

