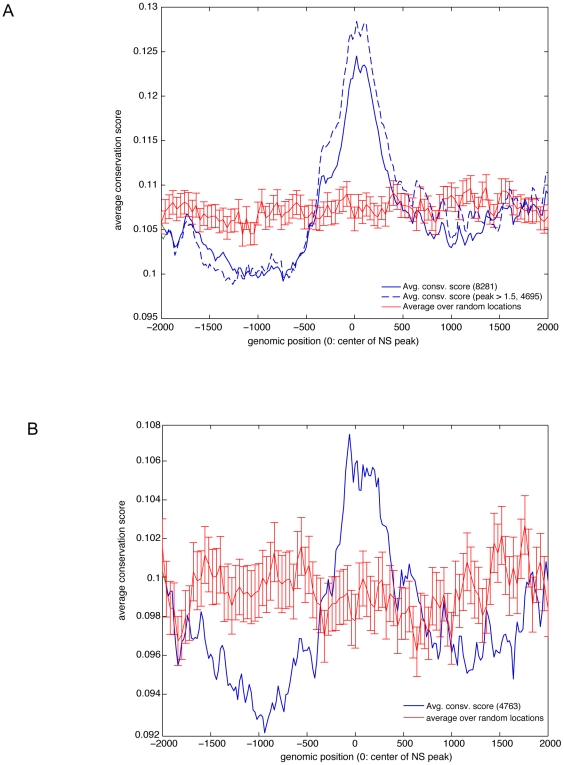
Figure 6. Association of origin peaks with evolutionarily conserved DNA sequences.
(A) Composite average conservation score around the highest point of origin peaks (peak to trough ratio >1 log-2 scale; total of 8281 initiation sites; or peak to trough ratio >1,5 ; total 4695 sites). Red lines with standard error bar denote the position of an equivalent number of sites randomly selected to develop a reference line. The statistical significance between the conservation score at the center of nascent DNA peaks with peak to through ratio >1 was highly significant (t-test, p = 1.1×10⁻¹⁴) (B) Composite average conservation score of non-genic conservation sequences around the highest point of origin peaks (peak to through ratio >1 log-2 scale; total of 4763). Red lines with standard error bar denote the position of an equivalent number of sites randomly selected to develop a reference line. The statistical significance between the conservation score of non-genic conserved sequences at the center of origin peaks with peak to trough ratio >1 was found to be statistically significant (t-test: p = 2.9×10⁻⁴).

