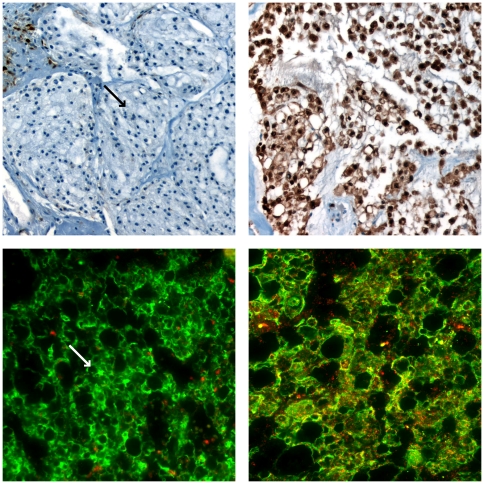
Figure 4. Top Panels: CDKN2A immunohistochemistry.
Representative chordoma cases showing lack of expression (left, CH39) and strong expression (right, CH35). Bottom Panels: PTEN Immunofluorescence. Representative chordoma cases were immunostained with anti-cytokeratin to highlight tumor cells (green) and anti-PTEN (red). Tumor cells show lack of PTEN expression in the left panel and expression of PTEN in the right panel. Note in both left panels that stromal tissue or normal cells show expression of CDKN2A and PTEN, but tumor areas indicated by arrows show lack of expression.

