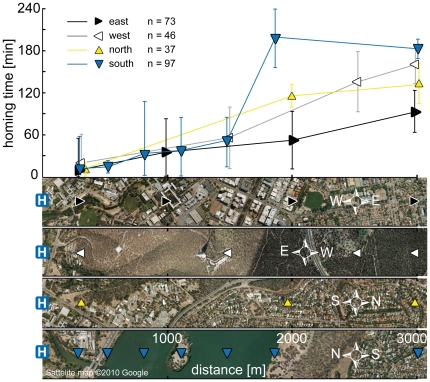
Figure 6. Homing time over land vs. water.
The graph compares homing times from up to 3000 m in four directions. Map strips show release spots over different terrain: urban areas in the east, forests west of the hive, urban areas north and the lake south of the hive. 20 bees were released at each spot, and homing times were calculated from bees returning on the day of release. Error bars show SD.

